How Do We Know the Market Is Shifting?
The control charts described in the video provide a 99.9% confidence level that the market is shifting when it signals a shift. Real estate statistics reflect the past. They don't show a shift or where the markets heading.
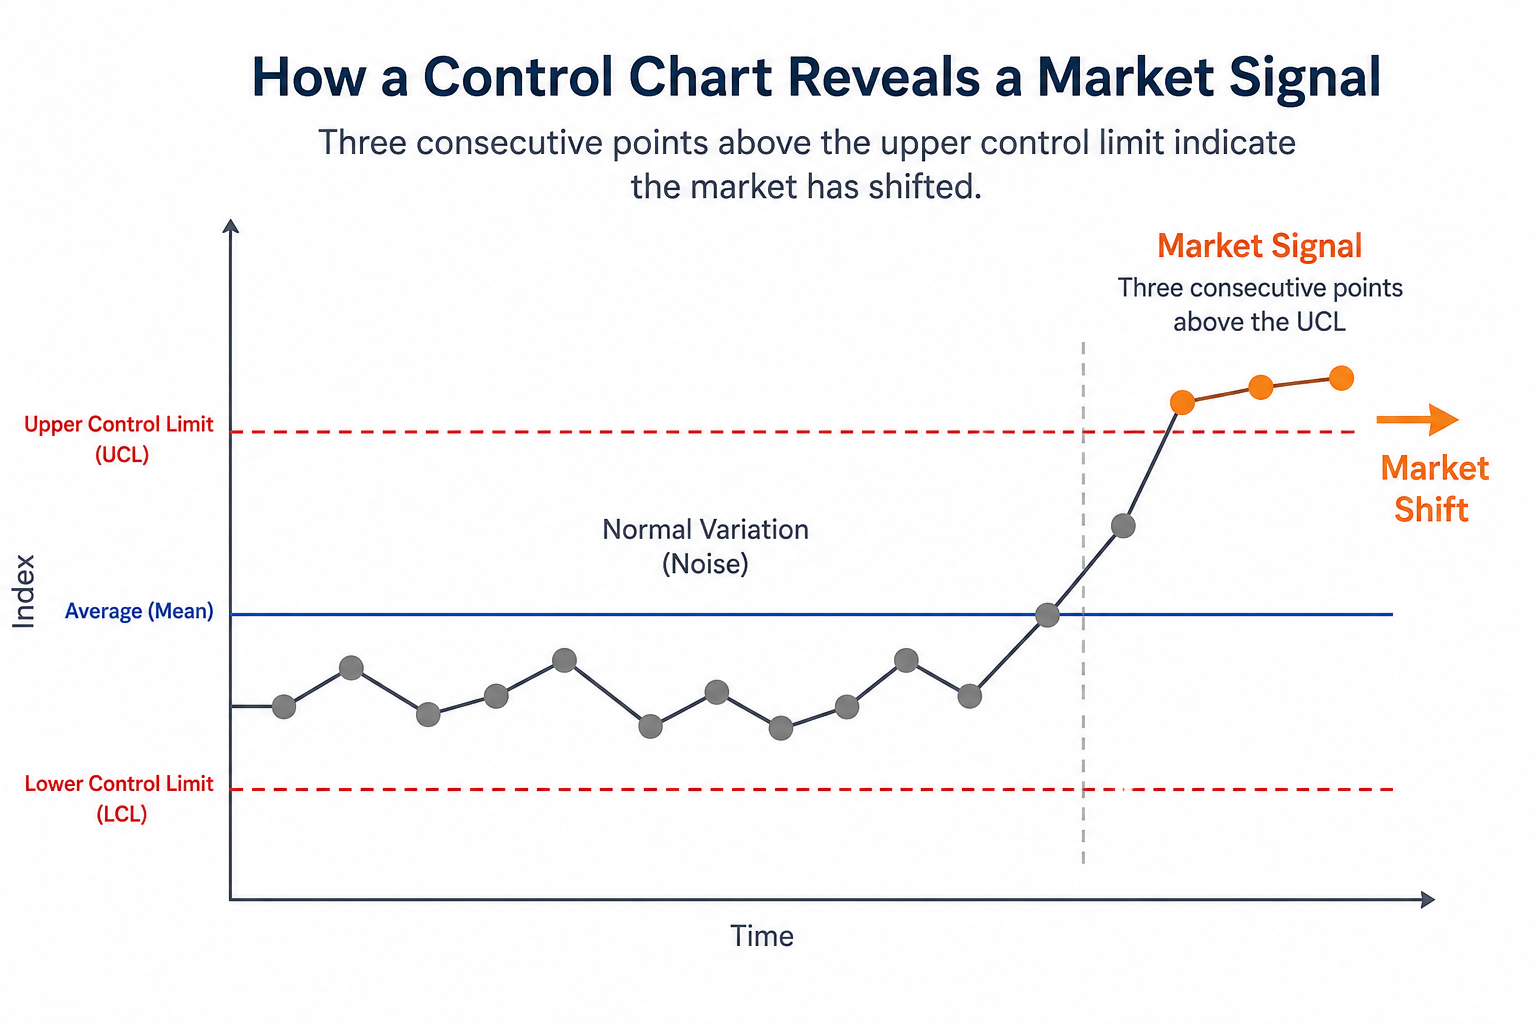
The illustration below shows how it works. Most market movement is simply normal variation—or noise. That’s when the data in the control chart is between the upper and lower control limits. But when the data behave differently than normal, they create a signal that the market is shifting. That’s when the data is above the upper control limit.
That's why our newsletter often identifies a shift a month or two before prices start falling, or before they start rising. As a buyer or seller, that knowledge is invaluable.