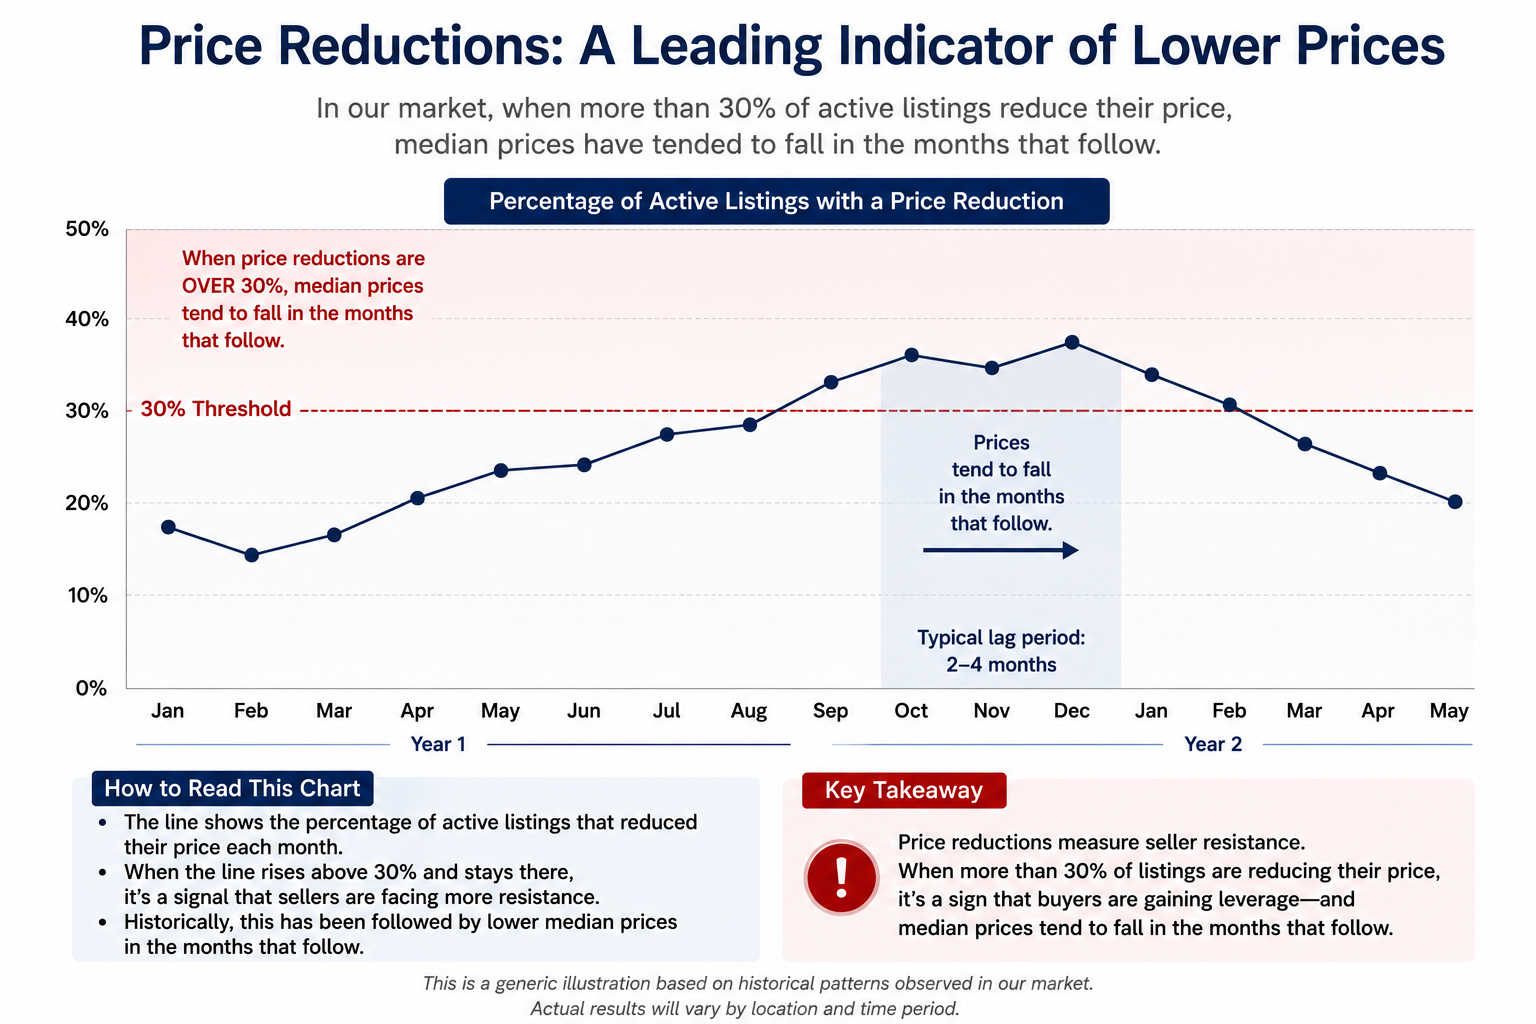
How do we know if prices are rising or falling before they rise or fall?
This is another chart where you can see the signal in the noise.
It tracks the percentage of active listings that reduce their price each week. From this chart, we can tell whether prices are likely to be rising, stable, or falling—and how quickly market conditions are changing.
Historically, when price reductions rise above 30% (the red shaded area), median prices have tended to fall within the next month or two. That makes this a valuable leading indicator for pricing, timing, and negotiation. When price reductions fall back in the normal range, it generally means, in our market, prices will be stable or rising.
Price reductions below 30% are generally considered noise—the normal variation found in most markets. Price reductions above 30% become a signal that the market is likely shifting.